
Successful Open Source projects are often a result of vibrant communities. Over the years, Drupal has evolved into one such ecosystem where people “come for the code & stay for the community.”
This contest is about showcasing the Drupal story. In an interactive and visual manner. We are inviting contestants to explore all data provided by Drupal.org at https://www.drupal.org/drupalorg/api and create interactive visualizations that could throw up interesting insights into the growth and adoption of Drupal over the years.
The winning entrant shall win Royal Enfield Classic* motorcycle.
The Drupal.org API exposes data points through the 'Node API' which provides data about content types like theme, projects, project_issue and distributions. Similarly, the 'User API' provides information about user registrations and details about user. User interactions like comments and when the comments were made can be fetched from the 'Comments API'. We would like you to explore all available APIs and data points for more such details.
For example, a few possible visualizations (and, you need not limit yourself to these alone) could include:
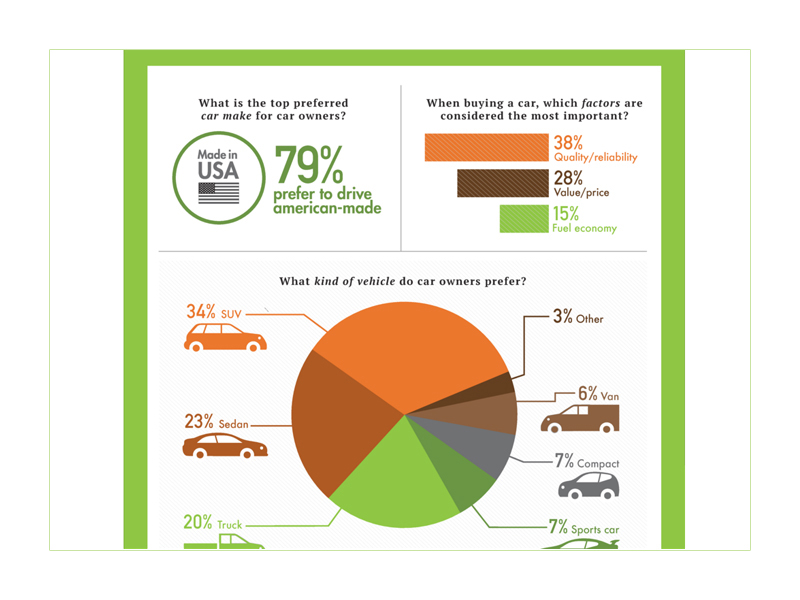
Automotive Infographic
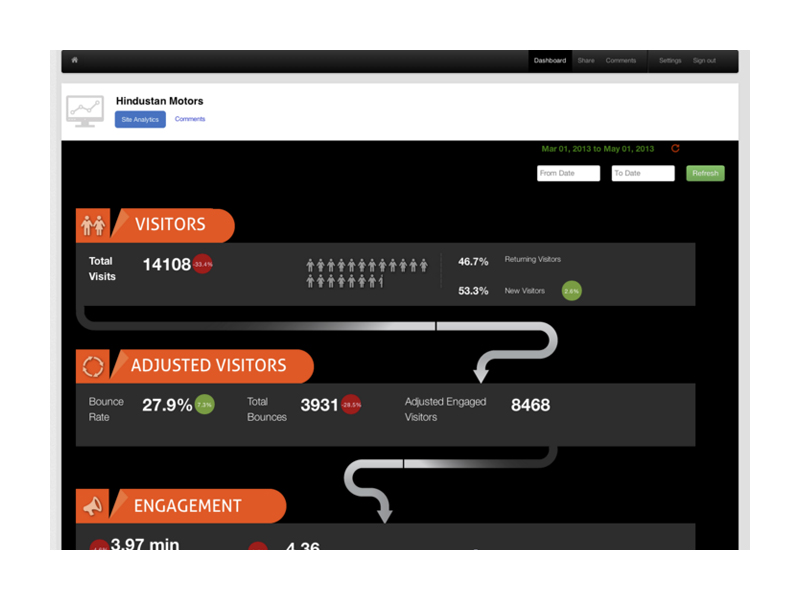
Reimagining Google Analytics
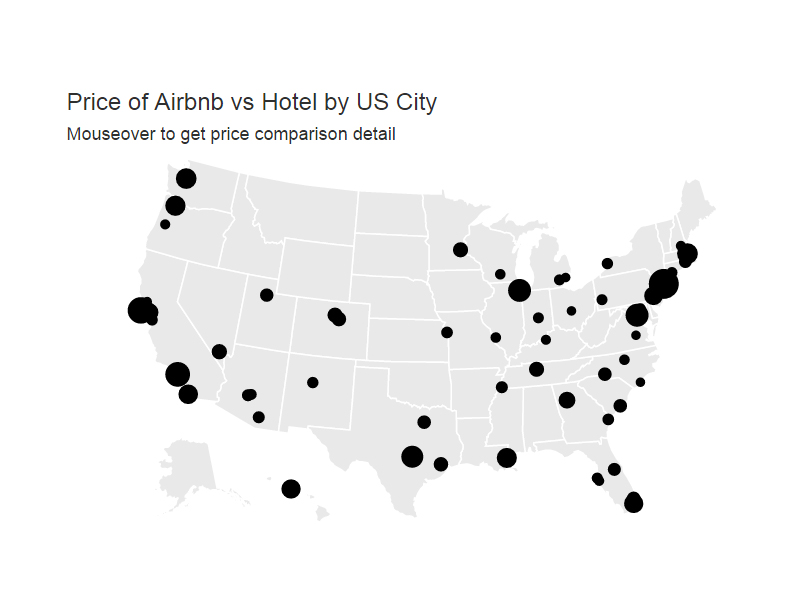
Airbnb vs Hotels: A Price Comparison
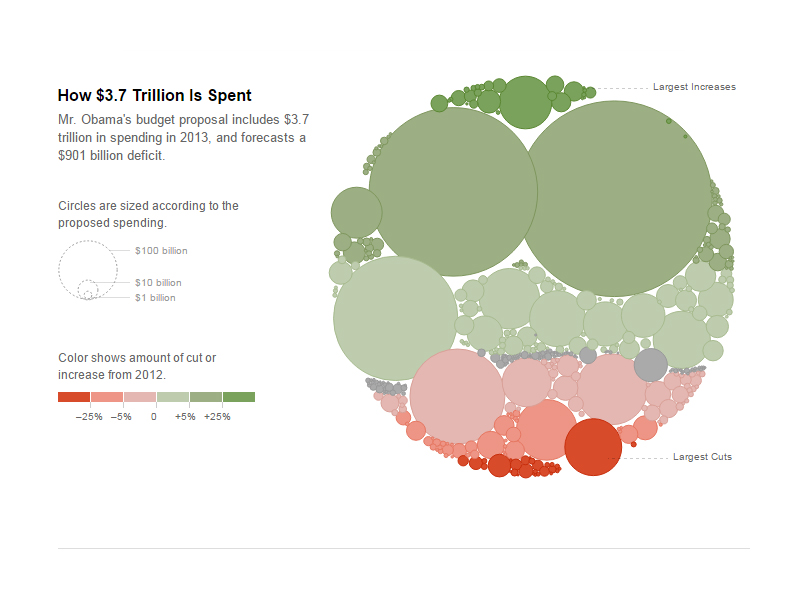
Four Ways to Slice Obama’s 2013 Budget Proposal
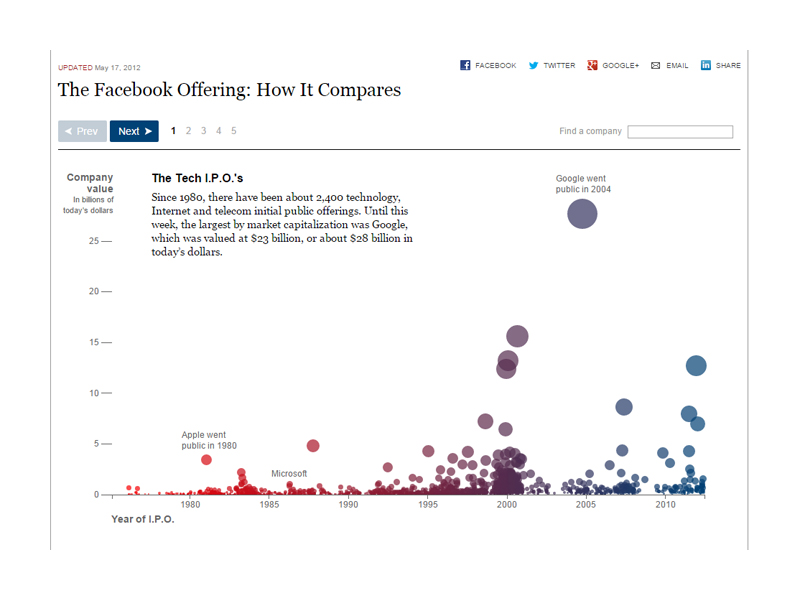
The Facebook Offering: How It Compares
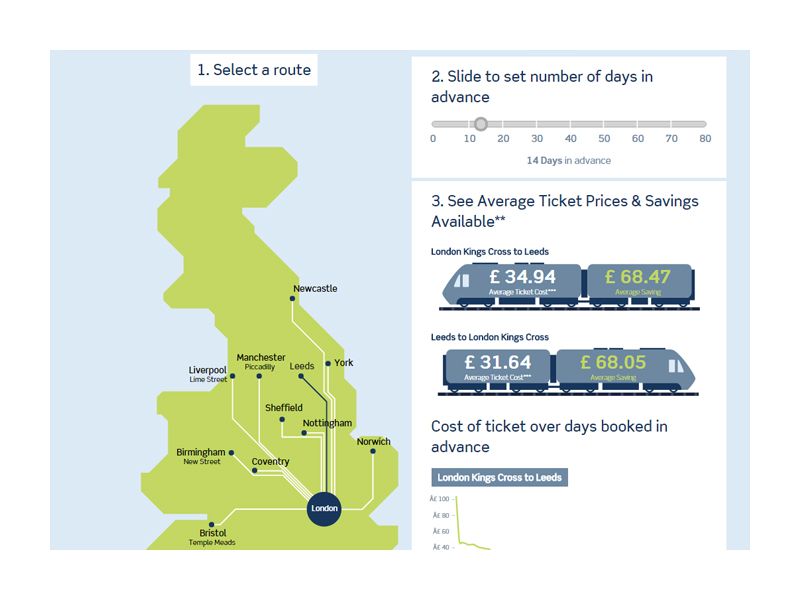
The Train Line
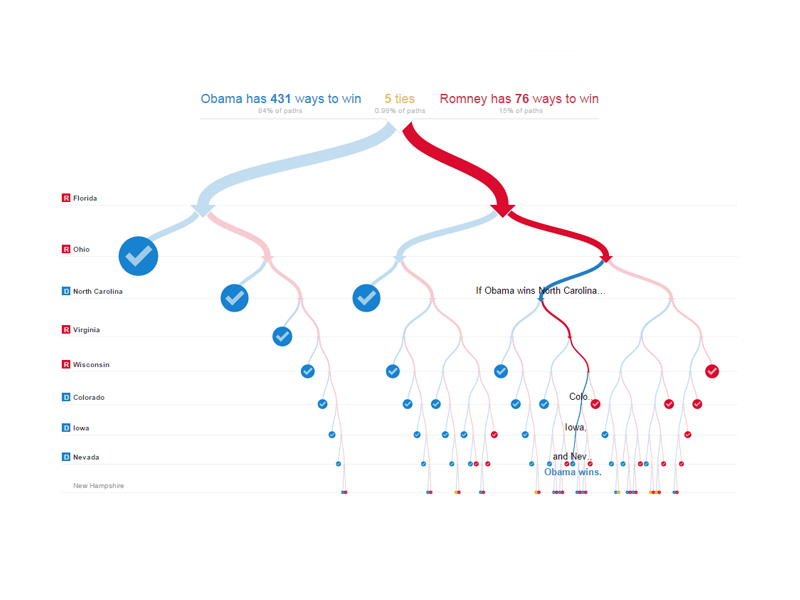
512 Paths to the White House
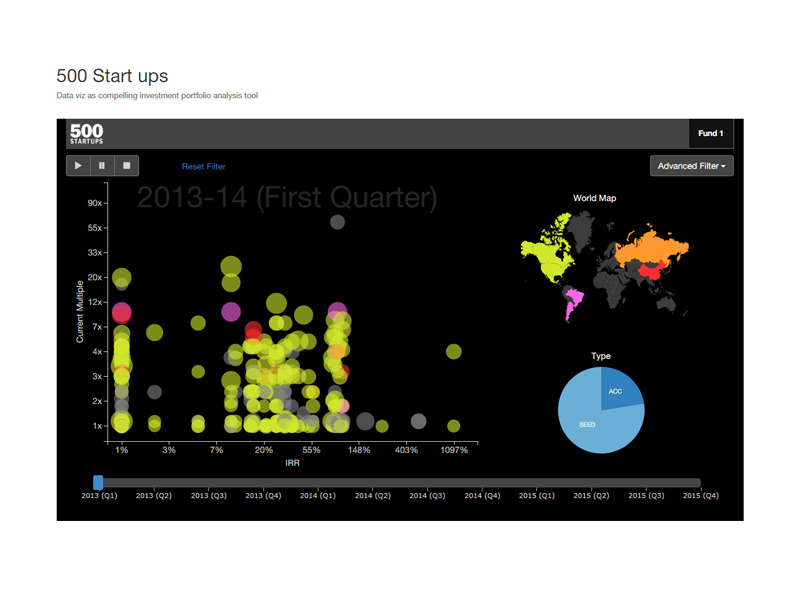
500 Start ups
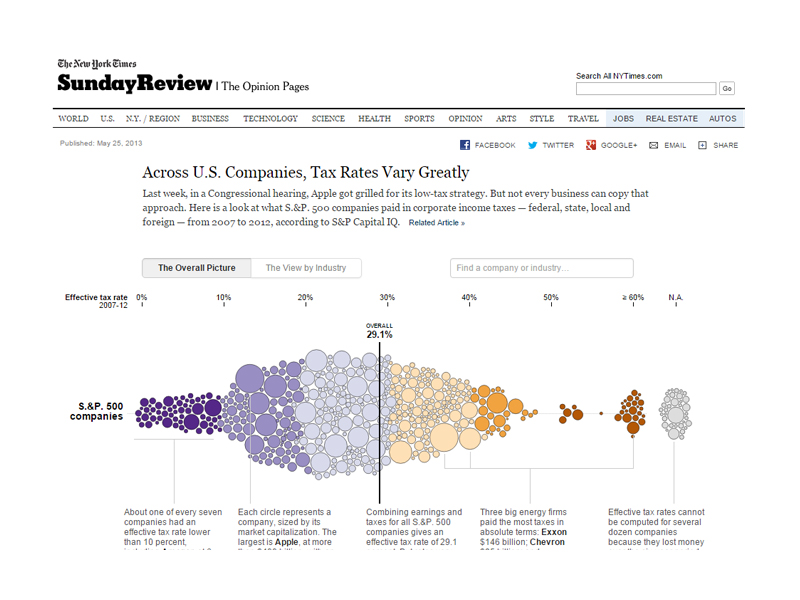
Across U.S. Companies, Tax Rates Vary Greatly